High Frequency Trading

Even though I’ve moved from swing trading to intraday trading I’m still relatively clueless regarding what exactly constitutes ‘High Frequency Trading’ and the prominent strategies within the domain. I’ve been reading a bit about it lately from Scott Patterson’s Dark Pools, an informative thread on Elite Trader, and I’ve chatted with a few locals who gave me a big picture view of the HFT space. I won’t delve into the debate of whether or not HFT is beneficial for market liquidity because I don’t have enough knowledge of market microstructure yet to understand the impacts of HFT.

General HFT

Here are some general facts on what I’ve learned so far:

  • Strategies are generally divided into liquidity-taking (gross positive, profit off prediction) and liquidity-providing (gross negative, profit off rebates).
  • HFT are VERY active in the ES markets. Most likely the most HFT-dominant market.
  • During mid-day when manual traders are less active, algorithmic activity is easier to detect and predict (I haven’t seen this myself, just heard from a trader).
  • Some strategies rely purely on exotic order types specifically designed by exchanges (Scott Patterson’s Dark Pools steers towards the idea that the majority of HFT exploits are derived from exotic order types but I’ve read conflicting opinions).
  • As one increases complexity and decreases latency sensitivity of a strategy, you increase its life expectancy, at the expense of increased risk (lower sharpe) and longer development time.
  • Time to deployment of a strategy varies widely. Some can be rolled out within hours to take advantage of opportunistics conditions created by information events. Others can take months to research.
  • “A typical [profit and loss] ratio for non-equities trading (equities trading is quite different due to rebates) might be something like 90% scratches, 8% winners, 2% losers. Expected profit on the order of 1/10 tick per contract traded overall”
  • The golden age of HFT is on a decline. Profit margins are shrinking and firms are closing left and right due to increased competition and low volatility within the markets.
  • Payouts from firms to the traders are commonly approaching 50% for highly supported operations, and up to 80% for capital backing.
  • All of the strategies are mainly variants of a core theory, but there are many excruciating details that can separate winners from losers
  • Some HFTs are profiting from other HFTs
  • Book order data is always recorded directly from the exchange, not typically bought from a third party vendor. Nobody uses consolidated feeds.
  • Speed in the market is important because of the need to send orders quickly and the ability to cancel quickly before adverse moves
  • Certain firms doing HFT in FX have “last look” privileges, allowing them to sit on an order and then decide if they will fill it. However if a firm does this too often (since providers get a report on last look rates) they lose order flow.
  • To break in the industry out of college, one should be CS/Math undergrad and/or post-grad from top school and unanimous passing of panel interviews. For someone with industry experience it’s all about the track record and fit.
  • For top-notch speed, equities is more expensive than futures connectivity. I believe this is due to inter-colocation costs. Paraphrased: one should be colocated on all lit exchanges at the very least, and also good dark pool access to make consistent money.
  • ROC is through the roof for HFT (500% is normal) but ROC isn’t as closely monitored. More importants statistics is risk/reward, where risk is relatively hard to define.
  • Sample specs for a colo-ed server: “Dell, customize an R620 with the highest end CPU(s) and that’s in the $5K-$10K general price range without any super customizations. 10G, centOS, 4/8/16 core arrangements”
  • They do not synchronize their clocks. For anything truly low latency, protocols such as NTP will most likely skew data at some part. All time analysis is measured relative to one central point (when data packet was received/when order was sent out)
  • With equities, relying on a single stock’s book order data will be enough to generate alpha for the system (net rebates) but for futures, one typically has to look at similar products too to use as a hedge or possibly prediction
  • Queue position is extremely important and can be used as an alpha signal in and of itself

Strategies

Here are some common strategies I’ve found that rely more on speed and less on prediction:

  • Single product scalping: Working the bid and offer in a product and trying to capture the bid/ask spread.
  • Inter-exchange arbitrage (Latency arb): Buying and selling the same product across multiple exchanges. Takes advantage of differing charactistics of exchanges and brokerage routing practices.
  • Futures vs. Spot basis spread trading: ES vs. SPY, EURUSD vs. 6E, etc.
  • Reaction to news: There are two forms: predictable news such as earnings announcements from feeds (NTKN, Reuters, DJ), and nonpredictable news such as trading halts.

A VERY basic market making model is as follows:

  • EdgeRequired = .1 ticks (user-defined)
  • TheoPrice = (BidPrice *AskVolume + AskPrice*BidVolume)/(AskVolume + BidVolume)
  • MyBid = TheoPrice – EdgeRequired
  • MyAsk = TheoPrice + EdgeRequired

The industry strategies are evolving to become more based on mathematical prediction rather than speed. I would believe this is to due to the fact that the speed advantage is dying out. Scott Patterson also states in his book that the speed advantage is almost gone and more and more firms are looking towards mathematical techniques to generate alpha.

Backtesting:

HFT strategies are very hard to backtest with strictly pure market making strategies. Common methodologies include:

  • Walk Forward: Simply use 1 lots to see if a strategy is profitiable. Scale if it is.
  • Trial and Error: Tweak settings whilst running a strategy with its former version to see which is more effective.
  • Post-trade Analytics: Analyze the trades you got into in order to improve the strategy.
  • Historical Data Analysis: Analyzing historical market data, but this typically isn’t traditionally backtesting where one simulates fills

Backtesting isn’t very common but there are a few players who have done it successfully due to sophisticated analysis. The software used is sophisticated enough to realistically simulate results. They incorporate information such as latency-distribution, queue position, exchange-specific information.

Abuse

There are also abusive practices I’ve stumbled upon:

  • Quote stuffing: Jamming up exchange lines with messages with the intent to slow down other participants.
  • Spoofing: Showing size on the market that you don’t intend to trade to trick other participants to move the market in a certain direction.
  • Flashing: Adding/Cancelling orders here and there to feel out other participants’s reaction.
  • Exotic order types: Certain order types are somehow abusive. Patterson’s book says that order types allow queue jumps but I haven’t read anything to confirm this. Patterson’s book says that this occurs very commonly but I haven’t read much on it outside of his book. Supposedly more concentraded in equities.

There are some newer abusive practices that I’ve stumbled upon from following Nanex articles. For example, from what I understand, a company that released earnings at 4:00pm made a signficant jump right before the close yet AFTER 4:00pm period due to HFT activity. Theoretically, one should not have been able to trade during this period; the only change in price should arise from trade settlement.

Firms

More-well known firms within the industry:

  • Teza
  • Getco
  • Virtu
  • HRT
  • Citadel
  • Tower
  • QuantLabs
  • RGM Advisors
  • Spot
  • Peak 6
  • Optiver
  • IMC
  • Jump
  • Allston
  • Volant
  • XR
  • Ronin
  • EWT
  • Eagle 7
  • Wolverine

Setting up

I couldn’t find much on setting up a practice, but here’s the limited information I did come across:

  • Big banks such as GS, JPM, ABN are the best brokers for HFT. There are a few competitive non-banks such as NewEdge. After scaling up sizeably they are relatively the same and differences are purely preferences.
  • Bigger brokers expect about $1 million in commissions each year from HFT
  • You HAVE to write your own routing software through DMA rather than relying on a routing platform
  • Advantage Futures is a good alternative for retail traders to get DMA

Questions I still have:

  • Does HFT use leverage? On one hand leverage doesn’t seem that difficult to get access to, but on the other HFT strategies seems limited on capacity. From what I’ve read it doesn’t seem that they use a lot of leverage.
  • What are public resources for learning how to do this on more of a retail basis? Being able to pull it off may be out of the question but at least learning some of the tactics may be beneficial.

If someone more knowledgable on the topic wants to chime in or message me to inform me better of the topic, it would be much appreciated!
On the Importance of Not Networking

The cardinal rule in business is that networking is key to success. While I’m not completely disagreeing with this statement, it should only be done in moderate dosages. These last few weeks there’s been a plethora of networking events to attend in Austin and I’ve attended every single one with nothing to show for my efforts. I’ve rubbed elbows with some very successful people, but I haven’t learned anything from those encounters. When I reached out to them to have lunch some time (they usually said yes) I often found myself grasping for questions to ask just because they didn’t know much about trading, and I didn’t need their knowledge on entrepreneurship. Listening to their success story is inspirational, sure, but there’s a point when one spends too much time listening to people talk about how they became successful rather than actually hunting it down yourself.

I’m not saying not to network at all, but I would venture to guess that when most people recommend networking they assume that you’re holing up and not talking to anyone else in your industry. If you’re already networking plenty, I’d make the suggestion to cut back, if not stop completely. Why do you need to network? Do you have a product that you are trying to market, a trading strategy that you need help refining, or is there some roadblock in your work that you need outside input on? If not than I see no point in going to networking events consistently. One has to sit down and work out the technical details before networking plays any benefit.

A few things that I’ve learned from this experience is that:

  1. Have a project in progress to work on – if you don’t even have a project you’re working on and you’re expecting these networking events to catapault you into success than you’re sorely mistaken. The only thing a networking event can do for your is to make you realize how important constantly working at a skill or idea you want to grow. You won’t have much to contribute to the conservation, nor have as much use for the advice many people will give you.
  2. Network with a specific goal in mind (sometimes) – You should only go to networking events often if you there is a specific roadblock you cannot solve on your own or with the help of the internet. Clearly this doesn’t mean to be a dick to people who can’t aid in your process, but don’t go out of your way to meet someone just because he/she is successful.

Granted there are exceptions to this rule: a good friend of mine has recently struck a partnership with a successful mathematician and is now in the process of launching a hedge fund that has already drawn a lot of local attention, but these occurences are not common. I know that I’m definitely going to cut back on these events and finally sit down to get some real work done.


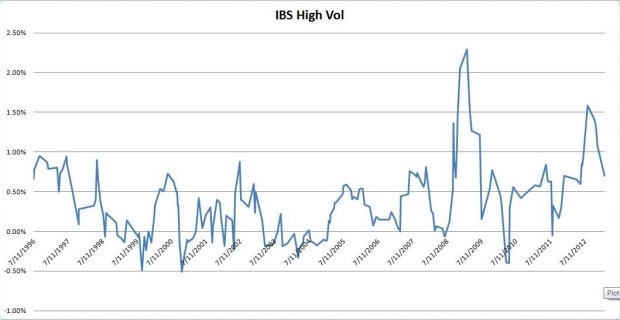
Mean-Reversion Volatility Filters Part Two: Since 2011

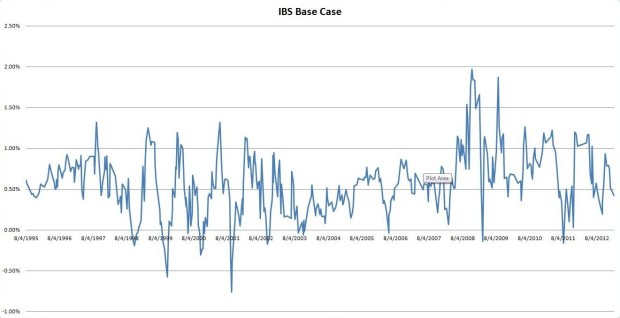
On my previous post, Mean-Reversion Volatility Filters, I used a dynamic volatility filter to filter out trades within  a short-term mean reversion system. I came to the conclusion that low vol was conducive for short term mean reversion performance. However, it’s commonly discussed how the market has shifted dynamics some time after the 2007-2008 financial crisis. In this post I revisit the tests ran in my previous post, testing from 1/1/2011 – 4/28/2013 rather than 1/1/1995 – 4/28/2013. The charts displayed below are 10-trade moving average of % profit from 1/1/1995-4/28/2013.

Results

IBS

Rules (Base-Case):

  • Buy if 3-Day IBS < 40
  • Sell if 3-Day IBS > 40
  • Avg. Trade: 0.53%

IBS Base Case 10-Trade MA

Rules (High Vol):

  • Buy if 3-Day IBS < 40 AND HV(5) > HV(20)
  • Sell if 3-Day IBS > 40
  • Avg. Trade: 0.68%

IBS High Vol 10-Trade MA

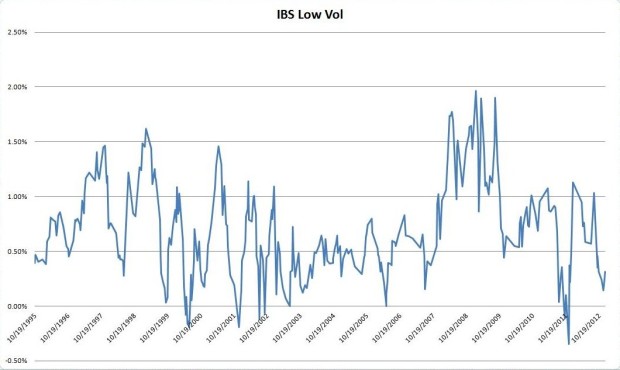
Rules (Low Vol):

  • Buy if 3-Day IBS < 40 and HV(5) < HV(20)
  • Sell if 3-Day IBS > 40
  • Avg. Trade: 0.38%

IBS Low Vol 10-Trade MA

RSI

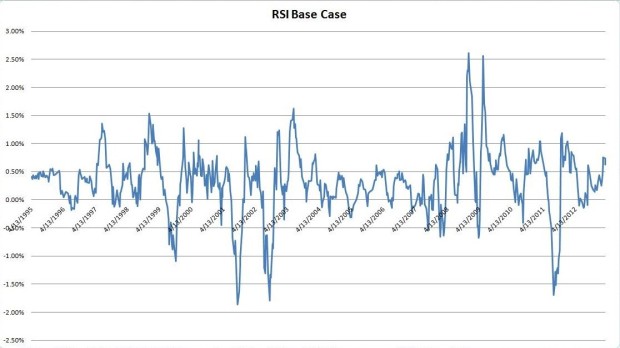
Rules (Base-Case):

  • Buy if 2-Day RSI< 50
  • Sell if 2-Day RSI > 50
  • Avg. Trade: 0.21%

RSI Base Case 10-Trade MA

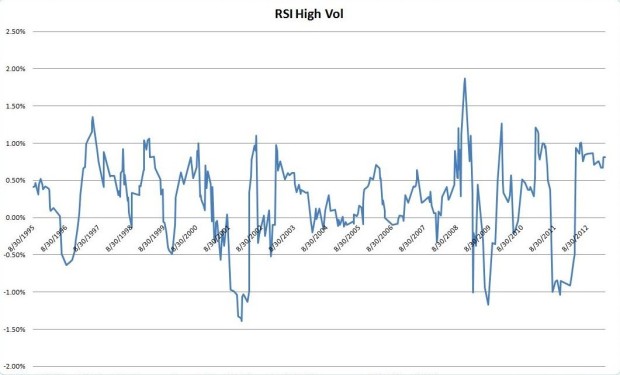
Rules(High Vol):

  • Buy if  2-Day RSI< 50 and HV(5) > HV(20)
  • Sell if 2-Day RSI > 50
  • Avg. Trade: 0.40%

RSI High Vol 10-Trade MA

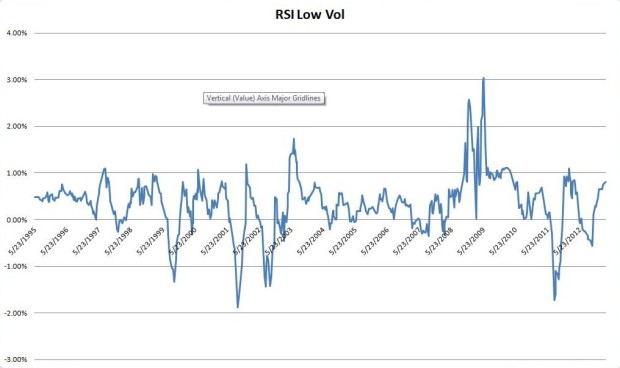
Rules(Low Vol):

  • Buy if  2-Day RSI< 50 and HV(5) < HV(20)
  • Sell if 2-Day RSI > 50
  • Avg. Trade: 0.10%

RSI Low Vol 10-Trade MA

Conclusion

Without looking at the charts, it may seem like post 2011, this volatility filter, like many strategies, has completely changed. However after looking at the charts of a rolling 10-trade moving average of % profit. the results become more inconclusive. It seems much more likely that the short term test results are due to unrepresentative and small sample size, rather than a change in volatility filter performance.


Mean-Reversion Volatility Filters

Due to the result’s of this MarketSci post, which imply that short-term mean reversion performs better during low volatility versus high volatility, I decided to revisit volatility filters. In Mean-Reversion within Regimes, I previously concluded that high volatility, not low volatility was more conducive to mean-reversion strategies. To test for low volatility/high volatility I decided to use a different filter. Last time I used a static test (60-Day Historical Volatility > 0.01 = High Volatility, <0.01 = Low Volatility). This time I will use a more dynamic filter, which compares short-term volatility to mid-term volatility.

Results

  • Testing on SPY from 1/1/1995- 4/28/2013

IBS

Rules (Base-Case):

  • Buy if 3-Day IBS < 40
  • Sell if 3-Day IBS > 40
  • Avg. Trade: 0.56%

Rules (High Vol):

  • Buy if 3-Day IBS < 40 AND HV(5) > HV(20) 
  • Sell if 3-Day IBS > 40
  • Avg. Trade: 0.39%

Rules (Low Vol):

  • Buy if 3-Day IBS < 40 and HV(5) < HV(20)
  • Sell if 3-Day IBS > 40
  • Avg. Trade: 0.68%

RSI

Rules (Base-Case):

  • Buy if 2-Day RSI< 50
  • Sell if 2-Day RSI > 50
  • Avg. Trade: 0.32%

Rules(High Vol):

  • Buy if  2-Day RSI< 50 and HV(5) < HV(20)
  • Sell if 2-Day RSI > 50
  • Avg. Trade: 0.27%

Rules(Low Vol);

  • Buy if  2-Day RSI< 50 and HV(5) < HV(20)
  • Sell if 2-Day RSI > 50
  • Avg. Trade: 0.37%

Conclusion

It seems from this, in combination with my previous conclusion from Mean-Reversion within Regimes, that the specific filter used for volatility has a large influence on profitability. One thing I realized is that there may be different exposures for low vol vs high vol (meaning that a high volatility filter may allow for more trades, resulting in a higher CAGR) which could result in the discrepancy in results (that is why I used Avg. Trade rather than CAGR this time), but even after re-running the different tests under the same conditions, high vol had a higher Avg. Trade vs low vol.

A New Approach to Trading

Recently I changed the way I approach trading system development. Reading A Different Approach to Money Management is what gave me the original idea to alter my approach to trading, but my research is what pushed me over the edge.

Old Way

I approached trading system development with the goal of trying to develop a system with maximum exposure. I didn’t think of running two systems at the same time on the same pool of money (without splitting up the money) if the systems had little/no conflicting signals. Since most of the systems I tested on SPY either had either:

  • high exposure but low returns
  • high returns (after factoring for exposure) but low exposure

I was left with trying to develop a new system, or trying to trade the system over a large group of stocks (I used the Nasdaq-100 as my stock universe). While I was able to ramp up my exposure to around 70% with any system I tested, I often had to trade 5 or more stocks just to have a reasonable draw-down, which meant that commissions ate a large percent of my trading profits, considering my systems were short term in nature and I have limited capital.

Pros:

  • Only one system to manage
  • I don’t have to check for as many signals

Cons:

  • Not diversified – higher risk
  • High commissions due to being forced to trade many stocks to increase exposure
  • Can be curve fit easily since I try to develop one super-system
  • Higher model risk – there is only one model, which can fail at any given time

New Way

Now, I try to develop multiple systems that have high average profit% per trade with little/no regard for exposure. Even if the system trades only once every two or three months, I can combine many of these systems to trade at a frequency I would be trading at with my old way, but still maintain a highly profitable trading system with lower risk (assuming the systems do not have perfect correlation). While it’s too soon to draw any conclusions from live performance, the historical backtest shows dramatically improved results.

Pros

  • Higher returns
  • Lower risk
  • Lower commissions since I only have to trade one stock (I trade SPY)
  • Less risk of curve-fit – I will not be forced to include multiple filters to decrease risk/increase returns
  • Lower model risk – chances of multiple models of failing is lower than one model failing

Cons

  • Much more of a headache to manage when entering in trades EOD

Trading Every Other Trading Day

Something odd that I found:

Test 1:

  • Buy SPY at close every other trading day
  • Sell the next day at close
  • 1/29/1993 – 3/25/2013

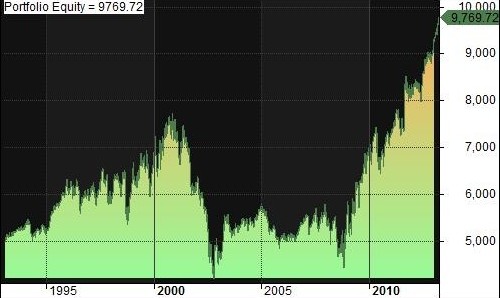
1-29-1993 - 3-25-2013 Trading Every Other Day

The 1990’s bull market, and the 2003-2007 market cycle are almost completely missing from the equity curve.

Test 2:

  • Buy SPY at close every other trading day
  • Sell the next day at close
  • 2/1/1993 – 3/25/2013

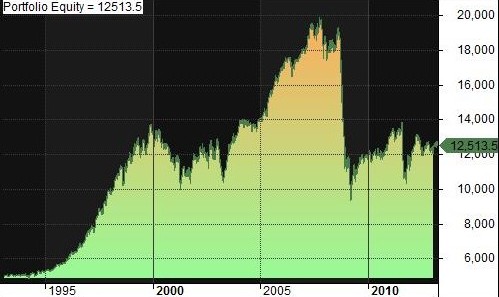
2-1-1993 - 3-25-2013 Trading Every Other Day

The popping of the tech bubble and the bull market since 2009 are almost completely missing from the equity curve.

Conclusion:

It’s incredibly strange how trading every other trading day can wipe out the gains/losses of any one cycle (1993-2003, 2003-2007, 2007-2013). What does this mean? Absolutely no idea.

Short Term Trend-Following within Mean-Reversion Trading

A while ago CSS Analytics had a post titled Improving Trend-Following Strategies with Counter-Trend Entries, which discusses using a mean-reversion indicator to filter out trades from a trend-following system. It got me thinking about using trend-following philosophy with mean-reversion trading systems. Mean-reversion is based off of buying dips; however, many times oscillators and other mean-reversion indicators are too quick when calling a market dip, and end up losing money the next day or so of an entered trade. To counter-act this tendency, why not use the old trend-following adage to only buy if the trend is up?

To test this, I used my favorite mean-reversion system:

  • Buy if DV2 < 50
  • Sell if DV2 > 50
  • No Shorting

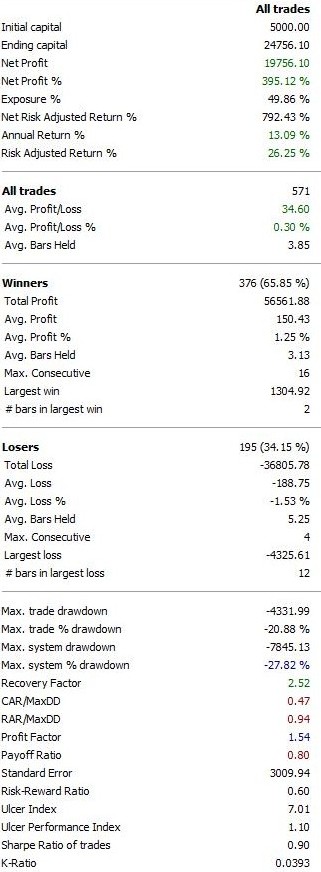
with two variations. Before I go into the two variations, I will post the results of this simple mean-reversion system traded on SPY from 1/1/2000 – 1/1/2013 for comparison. All results are  frictionless:

Simple DV2 1-1-2000 - 1-1-2013

Variation One

  • Buy if DV2 < 50 AND Today’s DV2 is ABOVE Yesterday’s DV2
  • Sell if DV2 > 50
  • No Shorting

Trend Following Entry DV2 1-1-2000 - 1-1-2013

Variation Two

  • Buy if DV2 < 50 AND Today’s Close is ABOVE Yesterday’s Close
  • Sell if DV2  > 50
  • No Shorting

Trend Following Entry with Close DV2 1-1-2000 - 1-1-2013

Variation One is vastly superior to the simple DV2 strategy when one factors for exposure and maximum drawdown. Variation Two has slightly lower returns when adjusted for exposure, but the maximum drawdown is reduced by 1/3. Using trend-following techniques to filter out bad trades can vastly increase risk-adjusted returns in mean-reversion trading systems.

Mean Reversion Trading in Moderation

Simple mean-reversion trading strategies in US equities have performed poorly since 2010/2011. Mean reversion is not dead, it never will be, but it may expressed differently than previously. Mean reversion prior to 2010, existed mainly in the form of extremes. The more extreme a pullback, the higher chance for a huge reversal. To test this, I ran 10 different frictionless  tests on SPY (from Yahoo! Finance) from 1/1/2000 – 1/1/2010.

Rules:

  • Buy if the 250-day DV2 is greater than a threshold AND if it is less than the threshold + 10 (this means I will only buy if the DV2 is within a certain 10 point range).
  • Sell the next day.
  •  It is worth noting here that I have an option on in AmiBroker that prevents me from entering buy orders the same day that I enter sell orders, which will lower the overall exposure of these systems.

Here are the results:

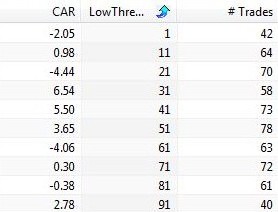
1-1-2000 - 1-1-2010 Moderate Mean Reversion

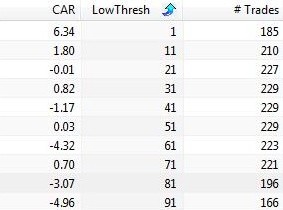
We can clearly see that the returns are largely derived from the 1-11 bucket, meaning that extreme mean reversion was the source of returns. In the past 3 years, mean reversion exists in more moderate forms. Extreme pullbacks no longer indicate large reversals, but moderate pullbacks are more indicative of future gains. To test this, I ran the same test from 1/1/2010 – 1/1/2013:

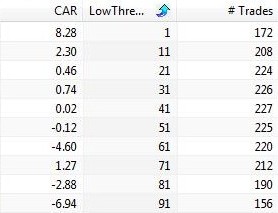
1-1-2010 - 1-1-2013 Moderate Mean Reversion

The returns for the past three years are from the 31-41, 41-51, and 51-61 bucket. The 1-11 bucket went from a 6% CAGR to a -2% CAGR.

Here are the rules for another test I ran. This should be the result of the above rules if I allowed entries to be entered the same day as exits.

Rules:

  • Buy if the 250-day DV2 is greater than a threshold AND if it is less than the threshold + 10 (this means I will only buy if the DV2 is within a certain 10 point range).
  • Sell if the 250-day DV2 is less than a threshold OR if it is more than the threshold + 10

Results for 1/1/2000 – 1/1/2010:

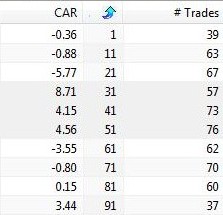
Full Exposure Moderate Mean Reversion 1-1-2000 - 1-1-2010

Results for the same test for 1/1/2010 – 1/1/2013:

Full Exposure Moderate Mean Reversion 1-1-2010 - 1-1-2013

This is only a preliminary test over SPY, but it does lead to avenues for further research.