Something odd that I found:
Test 1:
- Buy SPY at close every other trading day
- Sell the next day at close
- 1/29/1993 – 3/25/2013
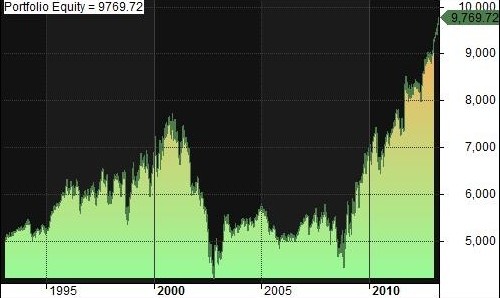
The 1990’s bull market, and the 2003-2007 market cycle are almost completely missing from the equity curve.
Test 2:
- Buy SPY at close every other trading day
- Sell the next day at close
- 2/1/1993 – 3/25/2013
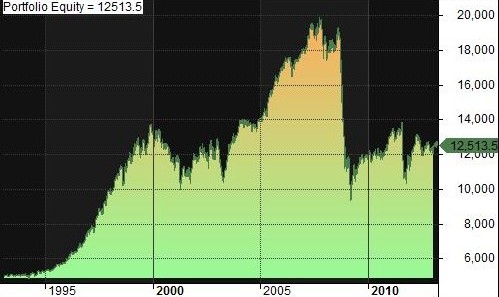
The popping of the tech bubble and the bull market since 2009 are almost completely missing from the equity curve.
Conclusion:
It’s incredibly strange how trading every other trading day can wipe out the gains/losses of any one cycle (1993-2003, 2003-2007, 2007-2013). What does this mean? Absolutely no idea.

One comment