Scaling In (Part Three): IBS & RSI

On my previous two posts regarding pyramiding (first post, second post), I tested three different entry methodologies using a DV2 across multiple securities. To obtain further results of the entry methodology within mean-reversion trading systems, I will test it on a simple IBS system and 2-day RSI system.

IBS

SPY

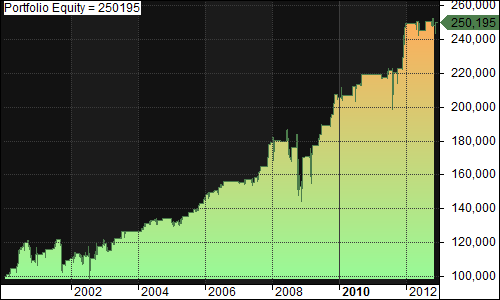
Default (Buy 100% of equity when IBS < 45, Sell 100% of position when IBS > 50):

  • Exposure: 42.51%
  • CAGR: 10.33%
  • MDD: 25.28%

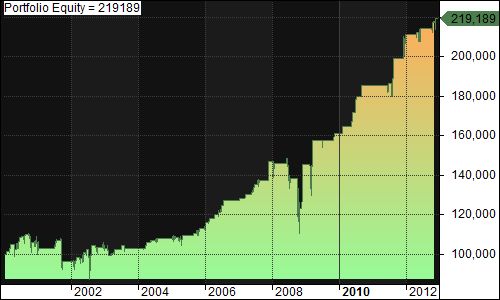
Purchase at first Dip (Buy 100% of equity the first day the close is less than the close of the day IBS < 45, Sell 100% of position when IBS > 50):

  • Exposure: 16.57%
  • CAGR: 7.38%
  • MDD: 15.63%

Scale In(Buy 50% of equity when IBS < 45, Buy 50% of equity more the first day the close is less than the close of the day IBS < 45, Sell 100% of position when IBS > 50):

  • Exposure: 28.59%
  • CAGR: 8.77%
  • MDD: 19.49%

Nasdaq-100

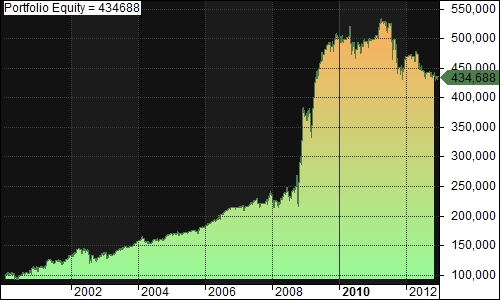
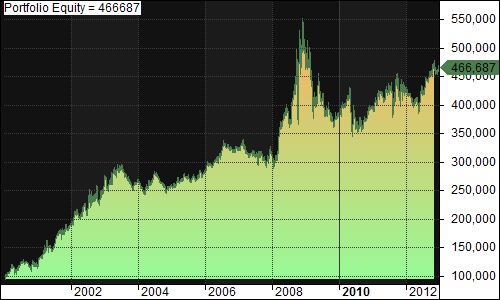
Default(Buy 6% of equity when IBS < 45, Sell 100% of position when IBS > 50):

  • Exposure: 77.56%
  • CAGR: 24.06%
  • MDD: 41.65%

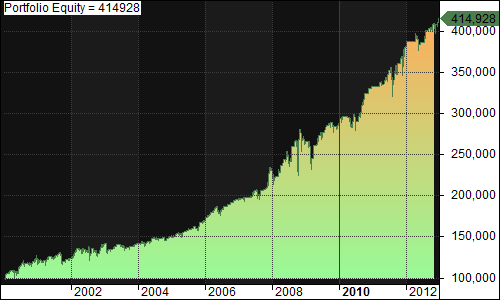
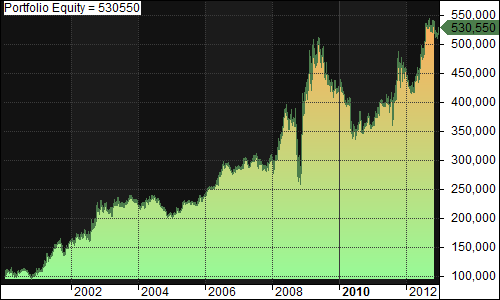
Purchase at a Dip(Buy 18% of equity the first day the close is less than the close of the day IBS < 45, Sell 100% of position when IBS > 50):

  • Exposure: 68.46%
  • CAGR: 41.04% (Better than DV2)
  • MDD: 32.76%

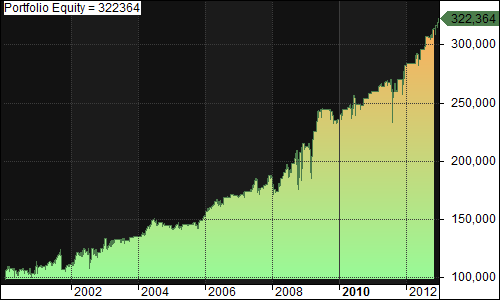
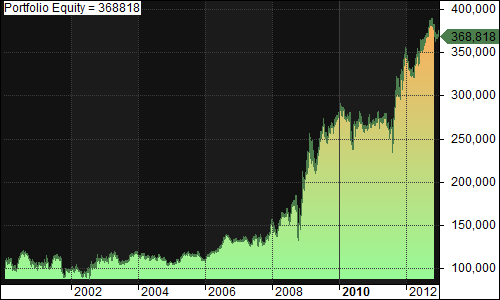
Scale In(Buy 3% of equity when IBS < 45, Buy 3% of equity more on each subsequent day the close is less than the close of the first day IBS < 45, Sell 100% of position when IBS > 50):

  • Exposure: 71.42%
  • CAGR: 29.46%
  • MDD: 40.33%

Individual Nasdaq-100

Lastly, I tested a system individually on each Nasdaq-100 stock.

Default(Buy 100% of equity when IBS < 45, Sell 100% of position when IBS > 50):

  • Average of Exposure: 44.96%
  • Standard Deviation of Exposure: 2.87%
  • Average of CAGR: 14.58%
  • Standard Deviation of CAGR: 16.04%
  • Average of MDD: 29.14%
  • Standard Deviation of MDD: 16.11%

Purchase at first Dip(Buy 100% of equity the first day the close is less than the close of the day IBS < 45, Sell 100% of position when IBS > 50):

  • Average of Exposure: 17.04%
  • Standard Deviation of Exposure: 2.55%
  • Average of CAGR: 3.94%
  • Standard Deviation of CAGR: 9.06%
  • Average of MDD: 21.57%
  • Standard Deviation of MDD: 14.23%

Scale In(Buy 50% of equity when IBS < 45, Buy 50% of equity more the first day the close is less than the close of the first day IBS < 45, Sell 100% when IBS > 50):

  • Average of Exposure: 30.82%
  • Standard Deviation of Exposure: 3.77%
  • Average of CAGR: 9.38%
  • Standard Deviation of CAGR: 11.37%
  • Average of MDD: 23.76%6.96/25.2
  • Standard Deviation of MDD: 14.97%

RSI

SPY

Default(Buy 100% of equity when RSI < 50, Sell 100% of position when RSI > 50):

  • Exposure: 44.40%
  • CAGR: 9.20%
  • MDD: 25.90%

Purchase at first Dip(Buy 100% of equity the first day the close is less than the close of the day RSI < 50, Sell 100% of position when RSI > 50):

  • Exposure: 25.27%
  • CAGR: 6.96%
  • MDD: 19.80%

Scale In(Buy 50% of equity when RSI < 50, Buy 50% of equity more the first day the close is less than the close of the day RSI < 50, Sell 100% of position when RSI > 50):

  • Exposure: 34.87%
  • CAGR: 8.19%
  • MDD: 20.34%

Nasdaq-100

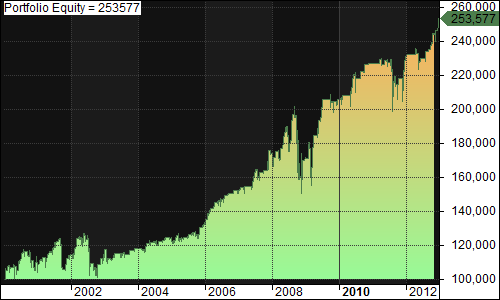
Default(Buy 2% of equity when RSI < 50, Sell 100% of position when RSI > 50):

  • Exposure: 68.08%
  • CAGR: 19.74%
  • MDD: 41.65%

Purchase at a Dip(Buy 6% of equity the first day the close is less than the close of the day RSI < 50, Sell 100% of position when RSI > 50):

  • Exposure: 71.59%
  • CAGR: 32.28%
  • MDD: 31.40%

Scale In(Buy 3% of equity when RSI < 50, Buy 3% of equity more on each subsequent day the close is less than the close of the first day RSI < 50, Sell 100% of position when RSI > 50):

  • Exposure: 69.75%
  • CAGR: 29.68%
  • MDD: 34.54%

Individual Nasdaq-100

Default(Buy 100% of equity when RSI < 50, Sell 100% of position when RSI > 50):

  • Average of Exposure: 44.73%
  • Standard Deviation of Exposure: 5.85%
  • Average of CAGR: 9.03%
  • Standard Deviation of CAGR: 11.96%
  • Average of MDD: 60.83%
  • Standard Deviation of MDD: 21.23%

Purchase at first Dip(Buy 100% of equity the first day the close is less than the close of the day RSI < 50, Sell 100% of position when RSI > 50):

  • Average of Exposure: 26.98%
  • Standard Deviation of Exposure: 3.39%
  • Average of CAGR: 9.03%
  • Standard Deviation of CAGR: 10.24%
  • Average of MDD: 50.77%
  • Standard Deviation of MDD: 20.91%

Scale In(Buy 45% of equity when RSI < 50, Buy 45% of equity more the first day the close is less than the close of the first day RSI < 50, Sell 100% when RSI > 50):

  • Average of Exposure: 37.99%
  • Standard Deviation of Exposure: 2.19%
  • Average of CAGR: 10.27%
  • Standard Deviation of CAGR: 11.25%
  • Average of MDD: 55.67%
  • Standard Deviation of MDD: 21.57%

Conclusion

At a quick glance, it’s clear that purchasing at the first dip for mean reversion trading systems seems to offer the best risk/reward ratio. At times, the differences are marginal, but after factoring for exposure, purchasing at first dip exceeds scaling in in (5/6) tests and the default trading system in (5/6) tests, on an absolute and risk-adjusted basis.

Scaling In (Part Two)

On Scaling In: Confusion (Part One) regarding pyramiding, I discussed the possibility of the Avg. Profit/Loss% performance metric being a subpar measure of system performance. To get a better understanding of system performance of buying on pullbacks, scaling, and default mean reversion trading systems, I decided to use two other performance metrics (three if you consider exposure a performance metric).

SPY

Default(Buy 100% of equity when DV2 < 50, Sell 100% of position when DV2 > 50):

  • Exposure: 49.61%
  • CAGR: 13.03%
  • MDD: 27.82%

Purchase at first Dip(Buy 100% of equity the first day the close is less than the close of the day DV2 < 50, Sell 100% of position when DV2 > 50):

  • Exposure: 25.52%
  • CAGR: 9.36%
  • MDD: 19.80%

Scale In(Buy 50% of equity when DV2 < 50, Buy 50% of equity more the first day the close is less than the close of the day DV2 < 50, Sell 100% of position when DV2 > 50):

  • Exposure: 37.64%
  • CAGR: 11.50%
  • MDD: 21.94%

Nasdaq-100

Default(Buy 2% of equity when DV2 < 50, Sell 100% of position when DV2 > 50):

  • Exposure: 69.75%
  • CAGR: 33.44%
  • MDD: 27.70%

Purchase at a Dip(Buy 6% of equity the first day the close is less than the close of the day DV2 < 50, Sell 100% of position when DV2 > 50):

  • Exposure: 68.07%
  • CAGR: 37.03%
  • MDD: 29.98%

Scale In(Buy 1% of equity when DV2 < 50, Buy 1% of equity more on each subsequent day the close is less than the close of the first day DV2 < 50, Sell 100% of position when DV2 > 50):

  • Exposure: 68.43%
  • CAGR: 38.03%
  • MDD: 27.22%

Individual Nasdaq-100

Default(Buy 100% of equity when DV2 < 50, Sell 100% of position when DV2 > 50):

  • Average of Exposure: 44.58%
  • Standard Deviation of Exposure: 6.43%
  • Average of CAGR: 15.76%
  • Standard Deviation of CAGR: 10.68%
  • Average of MDD: 54.95%
  • Standard Deviation of MDD: 19.95%

Purchase at first Dip(Buy 100% of equity the first day the close is less than the close of the day DV2 < 50, Sell 100% of position when DV2 > 50):

  • Average of Exposure: 24.22%
  • Standard Deviation of Exposure: 2.69%
  • Average of CAGR: 9.81%
  • Standard Deviation of CAGR: 8.22%
  • Average of MDD: 46.23
  • Standard Deviation of MDD: 18.34

Scale In(Buy 50% of equity when DV2 < 50, Buy 50% of equity more the first day the close is less than the close of the first day DV2 < 50, Sell 100% when DV2 > 50):

  • Average of Exposure: 36.82%
  • Standard Deviation of Exposure: 2.18%
  • Average of CAGR: 14.42%
  • Standard Deviation of CAGR: 9.66%
  • Average of MDD: 49.77%
  • Standard Deviation of MDD: 19.06%

Conclusion

The differences between each method seems negligible. Personally, I plan to use the purchase at first dip method. Even though the scaling in method and the first dip method have similar CAGRs after factoring for exposure (the first dip method has marginally higher CAGRs for 2/3 tests), the scaling in method will have higher commissions and slippage costs. The first dip method also had a lower MDD on 2/3 of the tests, but that has little to do with my decision. In Scaling In (Part Three) I reach similar conclusions, testing these entry methodologies across two other simple mean-reversion trading systems.

Scaling In: Confusion (Part One)

I’ve never quite understood the rational for scaling in for mean-reversion type trading systems. Scaling in for trend-following trades is simple and intuitive. By trading only a portion of your allocated capital at first, you can wait for further confirmation of the trend until you trade the rest of your capital. The trade off is that you will receive a worse entry price. However, for mean-reversion trading strategies you receive a better entry price at the cost of less trading opportunities. This may seem obvious, but my question is why scale in at all? Why not just place 100% of the order on the first or the second scaled-in purchase signal? Intuitively, it seems like either purchasing 100% of the position at the initial buy signal, or purchasing 100% of the position at the first dip after the buy signal, would produce the best results, and scaling in would only produce a return somewhere in between the other two results.  To test this out, I backtested three frictionless versions of a simple long-only DV2 system on SPY from 1/1/2000 – 2/5/2013.

Default(Buy 100% of equity when DV2 < 50, Sell 100% of position when DV2 > 50):

  • Number of trades: 573
  • Avg. Profit/Loss %: 0.30%

Purchase at first Dip(Buy 100% of equity the first day the close is less than the close of the day DV2 < 50, Sell 100% of position when DV2 > 50):

  • Number of trades: 292
  • Avg. Profit/Loss %: 0.43%

Scale In(Buy 50% of equity when DV2 < 50, Buy 50% of equity more the first day the close is less than the close of the day DV2 < 50, Sell 100% of position when DV2 > 50):

  • Number of trades: 575
  • Avg. Profit/Loss%: 0.55%

I tested a similar system on all Nasdaq-100 stocks (that are currently listed as of 2/15/2013. Does contain survivorship bias).

Default(Buy 2% of equity when DV2 < 50, Sell 100% of position when DV2 > 50):

  • Number of trades: 38998
  • Avg. Profit/Loss%: 0.52%

Purchase at a Dip(Buy 6% of equity the first day the close is less than the close of the day DV2 < 50, Sell 100% of position when DV2 > 50):

  • Number of trades: 13056
  • Avg. Profit/Loss%: 0.59%

Scale In(Buy 1% of equity when DV2 < 50, Buy 1% of equity more on each subsequent day the close is less than the close of the first day DV2 < 50, Sell 100% of position when DV2 > 50):

  • Number of trades: 37342
  • Avg. Profit/Loss%: 1.48%

Lastly, I tested a system individually on each Nasdaq-100 stock.

Default(Buy 100% of equity when DV2 < 50, Sell 100% of position when DV2 > 50):

  • Average of Avg. Profit/Loss%: 0.50%
  • Standard Deviation of Avg. Profit/Loss%: 0.22%

Purchase at first Dip(Buy 100% of equity the first day the close is less than the close of the day DV2 < 50, Sell 100% of position when DV2 > 50):

  • Average of Avg. Profit/Loss%: 0.57%
  • Standard Deviation of Avg. Profit/Loss%: 0.34%

Scale In(Buy 50% of equity when DV2 < 50, Buy 50% of equity more the first day the close is less than the close of the first day DV2 < 50, Sell 100% when DV2 > 50):

  • Average of Avg. Profit/Loss%: 1.07%
  • Standard Deviation of Avg. Profit/Loss%: 0.26%

The results produce a unanimous conclusion across all three tests: scaling in produces the best average profit/loss. The only possible explanation I can think of is this: Avg. Profit/Loss % is independent of position sizing (meaning that a 2% gain on 50% of equity is the same as a 2% gain on 100% of equity) so scaling in would produce an outsized Avg. Profit/Loss% because the system contains the trades that never face a loss throughout its life, while being able to average down on trades that do contain a loss. Since these two types of trades will be weighted equally in the calculation of Avg. Profit/Loss% (because of the fact that the metric is independent of position sizing) it substantially boosts Avg. Profit/Loss%. In essence, I picked a subpar performance metric (Scaling In (Part Two) is a posts that run the same tests with a different performance metric). If anyone has any other insights as to why this occurs, please comment below!

Short Selling

My mentor discouraged me from short selling completely until I become a more skilled trader due to its inherent disadvantages. Profitable trading, after all, is the accumulation of small statistical edges that, over time, will produce sustained profits. Here are the disadvantages inherent one faces when short selling:

  1. Asymmetric Returns
    • There is only a possibility of 100% returns, while the downside risk is theoretically unlimited. It is rare, but it is certainty not unheard of for stocks to increase over two-fold.
  2. Negative Edge
    • The markets have historically had an upward bias. This upward bias is not limited to US or European markets only.
  3. Psychology/Career Risk
    • It is easy to make money while others are losing it, but extremely difficult to lose money while everyone else is gaining, especially if you are a professional money manager.
  4. Recall Risk
    • Possibility of the lender requesting the stock back from the borrower before he/she is prepared to close-out. One study suggests that this occurs to roughly 2% of loans.
  5. Rebate Rates
    • These are the rates a borrower is paid for his cash collateral, which are determined by the supply/demand for borrowing a stock. Taken from Fabozzi’s Short Selling: “on less widely held securities or securities with large borrowing demand, rebate rates may be reduced, in which case, the securities are said to be “trading special” or just “special…… In rare cases, when a stock is in high demand, the rebate rate can be significantly negative…. Only well-placed investors (e.g., hedge funds) will be able to borrow specials and receive the reduced rebate. Generally, brokers will not borrow special shares on behalf of small investors..”

For further reading, read Fidelity’s “The hidden risks of short selling

The Signal and the Noise Review

I just managed to finish the The Signal and the Noise: Why So Many Predictions Fail but Some Don’t [Note: This is an affiliate link], by Nate Silver. It was an enjoyable read from a personal perspective, but only because I just enjoy reading technical books written towards a laymen audience, such as this book, Fooled By Randomness, The Black Swan, etc. However, I didn’t really learn that much from this book, and I wouldn’t recommend it if you are knowledgeable about basic trading system design methodologies and problems.

Things that I learned:

  1. Philip Tetlock’s Hedgehog vs Foxes 

    • Reading about this was more of a refresher because I vaguely recall reading this somewhere else, but it was useful re-solidifying the information.
    • While reading Falkenblog’s review of the Signal and the Noise, he mentioned John Cochrane’s opinion on the Hedgehog vs Fox debate which I found insightful
  2. The Frequentism vs Bayesianism debate

Things that I already knew:

  1. Financial data is prone to look-ahead bias
  2. Simpler models are often better
  3. Sometimes the data set does not provide signal, only noise
  4. More competition = less profits, especially for the less skilled
  5. Don’t over optimize models

Rotational Momentum Investing: Normalizing the Data

I’ve been looking into trading a rotational model using momentum lately. This post covers a few good reason for why one should trade momentum. My personal reasons are:

  • It provides diversification
    • I plan to trade a mean-reversion system soon, so adding a trend-following trading system will smooth my equity curve.
  • It is proven within academia
    • There are multitudes of research papers written over the momentum effect, and it is well-established anomaly within academia. You can find some of these for free over at QuantPedia.
  • Easy to trade
    • Trading a momentum system will only require to monitor it weekly, or monthly, leaving time for research into other efforts.

The momentum system being tested:

  • Invests 100% of equity in the top four stocks using equal weights.
  • The stock universe is all NASDAQ-100 stocks according to the NASDAQ website on 01/01/2013 (ticker list: NASDAQ Ticker List)
    • Not free from survivor-ship bias – results will be inflated
  • Test will be frictionless, from 01/01/1998 – 01/13/2013
  • Re-ranks and trades monthly. Does NOT re-balance monthly.
    • I used AmiBroker to test this. I re-rank at the first, second, and third day of every month. I also set an option where I am forced to hold onto a position for at least 5 days before selling. There are some occurrences where this may not perfectly replicate a monthly re-rank.

For this test, I will be using four different indicators:

  • TSI()
    • CAGR: 31.52%
    • MDD: -69.06%
  • Close relative to the 250-day high of the high
    • CAGR: 13.38%
    • MDD: -50.84%
  • 250-day ROC of Close
    • CAGR: 35.25%
    • MDD: -73.00%
  • Close relative to the all-time high of the high
    • CAGR: 15.17%
      MDD: -49.86%

For the purposes of creating a better performing ranking criterion, I will aggregated all four indicators into one. There are two obstacles I must first overcome:

  1. Normalizing the criterion
    1. The four indicators each have different scalings and different distributions. To create an aggregate indicator, we should normalize the indicators so they have similar sensitivies.
  2. Weighting the criterion
    1. The four indicators will most likely not contribute equal amounts to increasing performance. TSI() may have twice as much predictive power as the 250-day ROC, or it may be the other way around. Designing a weighting scheme will assign relative importance to the contribution of an indicator to ranking criterion

Normalizing the data:

There are two methods of normalizing the data which I will be testing for individual performance. The perfect rank function, and the z-score function.

Z-Score:

  • TSI()
    • CAGR: 18.48%
    • MDD: -68.04%
  • Close relative to the 250-day high of the high
    • CAGR: 17.33%
    • MDD: -49.88%
  • 250-day ROC of Close
    • CAGR: 25.55%
    • MDD: -46.69%
  • Close relative to the all-time high of the high
    • CAGR: 19.29%
    • MDD: -42.78%

Percent Rank:

  • TSI()
    • CAGR: 20.21%
    • MDD: -65.30%
  • Close relative to the 250-day high of the high
    • CAGR: 14.45%
    • MDD: -54.53%
  • 250-day ROC of Close
    • CAGR: 22.48%
    • MDD: – 45.45%
  • Close relative to the all-time high of the high
    • CAGR: 16.07%
    • MDD: -50.51%

Conclusion:

Z-score turned out to be better at normalizing indicator sensitivities while maintaining (or in the case of close relative to the all-time high of the high/250-day high of the high, increasing) performance.  From this test, we can also form a tentative conclusion that TSI and 250-day ROC are indicators that perform better as a ranking indicator on an absolute basis (it doesn’t matter historically where the indicator resided), whereas for indicators such as the close relative to a variable, they perform better on a relative basis (where the indicator has resided historically positively impacts performance).

4-Hour Body Principles in Trading

I was reading The 4-Hour Body by Tim Ferriss and found two quotes that are highly applicable to trading:

On psychology:

Does that mean [the workout routine] won’t work for some people? No, it just means that it will fail for most people. We want to avoid all methods with a high failure rate, even if you believe you are in the diligent minority. In the beginning everyone who starts a program believes they’re in this minority.

Take adherence seriously: will you actually stick with this change until you hit your goal?

If not, find another method, even it it’s less effective and less efficient.

On listening to others:

Everyone you meet (every male, at least) will have a strong opinion about how you should train and eat. for the next two to four weeks, cultivate selective ignorance and refuse to have bike-shed discussions with others. Friends, foes, colleagues, and well-intentioned folks of all stripes will offer distracting and counterproductive additions and alternatives.

Nod, thank them kindly, and step away to do what you’ve planned. Nothing more and nothing different.

RSI of Volatility Indicator

It’s common knowledge by now that low volatility is conducive to bullish behavior and high volatility is conducive to bearish behavior. To create a trading system that would short bursts of high volatility and buy short periods of low volatility I took the 5-day RSI of the daily Close-Open Range.

Edit: Commenter Ramiro called to my attention that I do not actually take the RSI of the Close-Open range, just the Close-Open. I’m actually measuring the magnitude AND the direction, meaning that this is just simply another mean-reversion indicator, NOT a volatility indicator.

To turn my indicator into a trading system, I optimized buy and sell threshold (1-100) on SPY from 1/1/2000 – 12/29/2012. I optimized a long-only version of the system. Here is a picture of the 3D optimization with CAGR on the z-axis.

RSI 5-Day Extreme Close Range Optimization Buy Thresh 1-1-2000 - 12-29-2012

Buy Threshold

RSI 5-Day Extreme Close Range Optimization Sell Thresh 1-1-2000 - 12-29-2012

Sell Threshold

There is a small hilly region near the middle. I chose 40 as my buy threshold and 55 as my sell threshold since they are round numbers within the hilly region.

One thing peculiar that I noticed, but can’t seem to explain is that there are two of every set of system statistics, and the only difference is 1) the parameters of buy/sell threshold are switched and 2) the number of trades:

RSI 5-Day Extreme Close Range Optimization Peculiar 1-1-2000 - 12-29-2012

After some pondering I noticed that it might be because some of the buying is negligible. For example, if we have a 40/60 threshold then we will buy if the RSI is at 30, regardless if the 40 or the 60 is the buy threshold. However, the problem that I came across is that if the RSI is at 30 today, but is at 50 tomorrow, then we will buy & hold for a 40/60 threshold (buy when RSI < 40 and sell when RSI > 60), but we will buy & sell for a 60/40 threshold ( buy when RSI < 60 and sell when RSI > 40). I can’t seem to figure out why there each set of system statistics has a twin.

Next, I optimized the short and cover threshold (1-100) on the same data, using a short-only version of the system. Here is a picture of the 3D optimization with CAGR on the z-axis.

RSI 5-Day Extreme Close Range Optimization Short Thresh 1-1-2000 - 12-29-2012

Short Threshold

RSI 5-Day Extreme Close Range Optimization Cover Thresh 1-1-2000 - 12-29-2012

Cover Threshold

There is another small hilly region near the middle. I chose 55 as my short threshold and 40 as my cover threshold since they are round numbers within the hilly region.

The peculiarity of the long only side of the system does not seem to exist on the short side.

Here is the optimized equity curve with a system of the following rules:

  • Buy RSI < 40
  • Sell RSI > 55
  • Cover RSI < 40
  • Short RSI > 55

RSI 5-Day Extreme Close Range Optimization Equity Curve 1-1-2000 - 12-29-2012

The equity curve looks similar to that of many mean-reversion trading systems.

To check for robustness, I tested this system on multiple ETFs from 1/1/2000 – 12/29/2012.

RSI 5-Day Extreme Close Range ETF Scan 1-1-2000 - 12-29-2012

For further robustness, I tested this system using different lengths of RSI on SPY.

RSI 5-Day Extreme Close Range Length Optimization 1-1-2000 - 12-29-2012

One of my concerns is the success of the system since 2010, since many systems seemed to have performed differently or even completely stopped working from around that period. Here is the performance of the system on multiple markets from 1/1/2010 – 12/29/2012

RSI 5-Day Extreme Close Range ETF Scan 1-1-2010 - 12-29-2012

Cumulative IBS Indicator

Inspired by Larry Connors’ Cumulative RSI(2) (found in this post), and the results of my Cumulative DV2 (found in this post) I decided to test out how a Cumulative IBS indicator would work. The formula for IBS can be found here, and the cumulative IBS is the X-day simple moving average of the IBS. This is a frictionless test on SPY from 1/1/2000 – 12/26/2012. I tested the cumulative IBS using default parameters from the original post I found over IBS (Long if IBS < 45 & Short if IBS > 95).

Equity curves for cumulative 1-9 day IBS. Starts at 1-day in the top left and ends at 9-day on the bottom right. It counts from left to right, meaning that the top middle picture is the cumulative 2-day IBS.

Cum 1-9Day IBS 45 95 1-1-2000 - 12-26-12

Equity curves for cumulative 10-18 day IBS. Follows same structure as above.

Cum 9-18Day IBS 45 95 1-1-2000 - 12-26-12

We can see the equity curves of the cumulative IBS reinforces the conclusion in the cumulative DV2 post.

Here are the individual graphs in anyone is interested:

IBS 45 95 1-1-2000 - 12-26-12

2-day

Cum 2Day IBS 45 95 1-1-2000 - 12-26-12

3-day

Cum 3Day IBS 45 95 1-1-2000 - 12-26-12

4-day

Cum 4Day IBS 45 95 1-1-2000 - 12-26-12

5-day

Cum 5Day IBS 45 95 1-1-2000 - 12-26-12

6-day

Cum 6Day IBS 45 95 1-1-2000 - 12-26-12

7-day

Cum 7Day IBS 45 95 1-1-2000 - 12-26-12

8-day

Cum 8Day IBS 45 95 1-1-2000 - 12-26-12

9-day

Cum 9Day IBS 45 95 1-1-2000 - 12-26-12

10-day

Cum 10Day IBS 45 95 1-1-2000 - 12-26-12

11-day

Cum 11Day IBS 45 95 1-1-2000 - 12-26-12

12-day

Cum 12Day IBS 45 95 1-1-2000 - 12-26-12

13-day

Cum 13Day IBS 45 95 1-1-2000 - 12-26-12

14-day

Cum 14Day IBS 45 95 1-1-2000 - 12-26-12

15-day

Cum 15Day IBS 45 95 1-1-2000 - 12-26-12

16-day

Cum 16Day IBS 45 95 1-1-2000 - 12-26-12

17-day

Cum 17Day IBS 45 95 1-1-2000 - 12-26-12

18-day

Cum 18Day IBS 45 95 1-1-2000 - 12-26-12

Cumulative DV2 Indicator

Inspired by Larry Connors’ Cumulative RSI(2) (found in this post), I decided to test out how a Cumulative DV2 indicator would work. This is a frictionless test on SPY from 1/1/2000 – 12/26/2012. I tested the cumulative DV2 using default parameters (Buy/Cover if DV2 < 50 & Sell/Short if DV2 > 50)

Normal DV2:

DV2 50 1-1-2000 - 12-26-12

2-day cumulative DV2

Cum 2Day DV2 50 1-1-2000 - 12-26-12

3-day cumulative DV2

Cum 3Day DV2 50 1-1-2000 - 12-26-12

4-day cumulative DV2

Cum 4Day DV2 50 1-1-2000 - 12-26-12

5-day cumulative DV2

Cum 5Day DV2 50 1-1-2000 - 12-26-12

6-day cumulative DV2

Cum 6Day DV2 50 1-1-2000 - 12-26-12

7-day cumulative DV2

Cum 7Day DV2 50 1-1-2000 - 12-26-12

8-day cumulative DV2

Cum 8Day DV2 50 1-1-2000 - 12-26-12

9-day cumulative DV2

Cum 9Day DV2 50 1-1-2000 - 12-26-12

10-day cumulative DV2

Cum 10Day DV2 50 1-1-2000 - 12-26-12

11-day cumulative DV2

Cum 11Day DV2 50 1-1-2000 - 12-26-12

The results make me think of one of David Varadi‘s posts (link) about how mean-reversion isn’t necessarily ‘dead’, it has only changed to become mean-reverting on a longer period of time (per the equity charts of the 4-9 day cumulative DV2). An adaptive framework similar to that found at this post by Sanz Prophet could definitely be used.