In my previous post, Mean-Reversion within Regimes, I discussed how volatility, trendyness, and bull/bear affected a simple mean-reversion trading rule. In this post I will elaborate upon the volatility and bull/bear regimes by testing performance using different lengths for my volatility & market direction indicators.
Volatility:
I will define high-volatility and low-volatility in two different ways. For the first method, I will define high/low volatility as
- HV: X-Day Standard Deviation of Daily Returns > Threshold Value
- LV: X-Day Standard Deviation of Daily Returns < Threshold Value
I optimized the length of the standard deviation look-back period, and the threshold value. CAGR/MDD was my objective function. The data was from Yahoo! Finance from 1/1/2000 – 12/7/2012. From now on, I will be using the same data set to conduct all further tests unless stated otherwise.
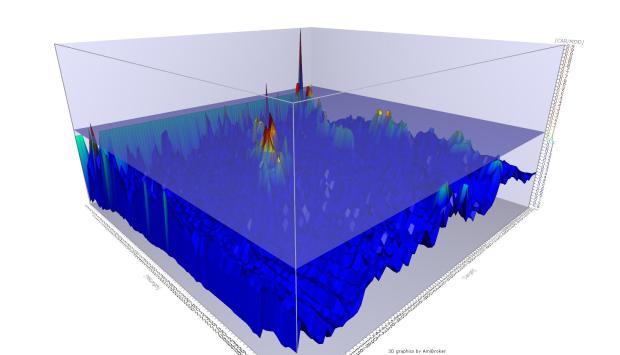
High Volatility:
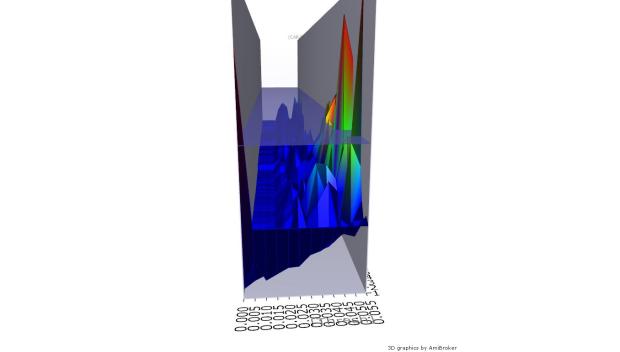
The values in the chart are threshold values.
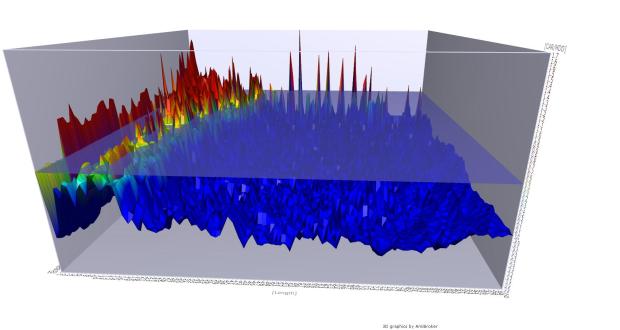
So from this we can draw the conclusion that a static threshold around .03-.04 is optimal for maximizing CAR/MDD.
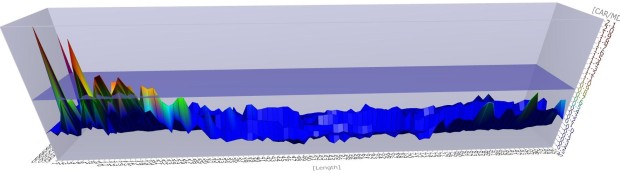
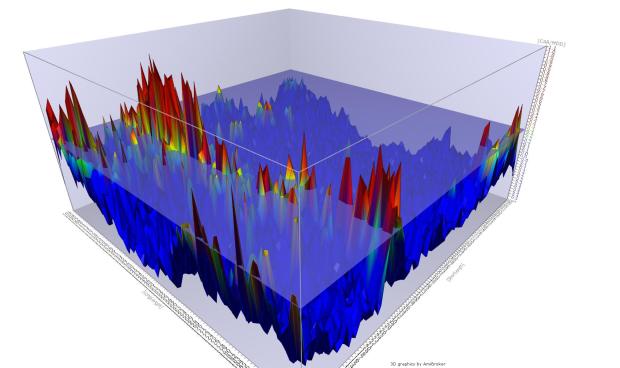
The values are the length of the standard deviation function
Optimal standard deviation lengths are 10-30.
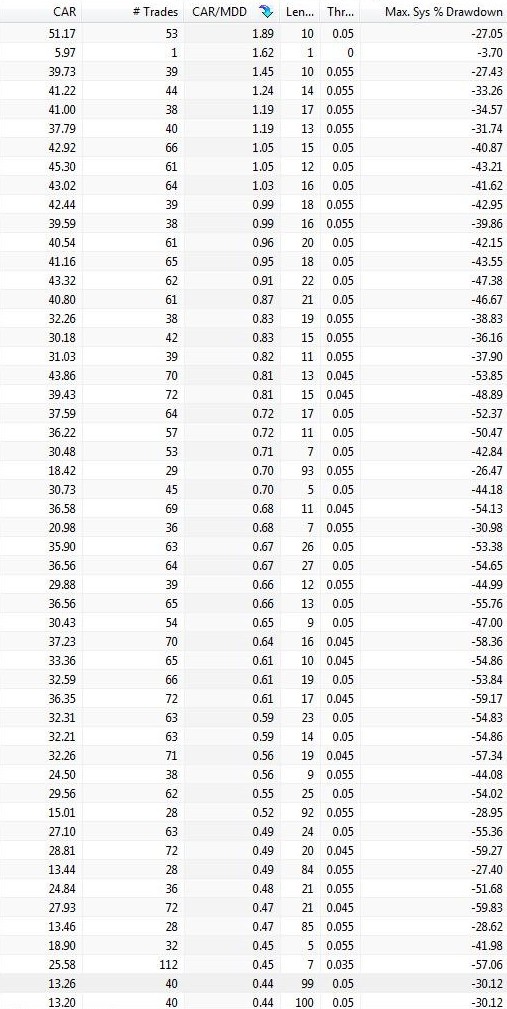
This chart was included to show that there were enough trades for the majority of the settings so that the results were statistically significant.
Low Volatility:
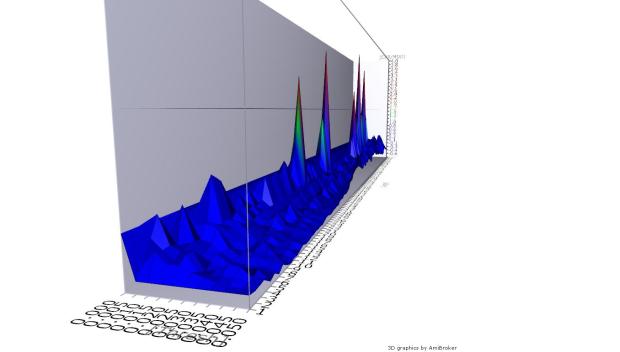
If we look closely towards the left of the graph we see that, generally, having a threshold value of 0 performs better than other threshold values. Since a threshold value of 0 means that no trades were taken place (since Standard Deviation has to be less than 0 for a trade to take place, which is mathematically impossible), this shows that trading in low-volatility periods deteriorates performance.
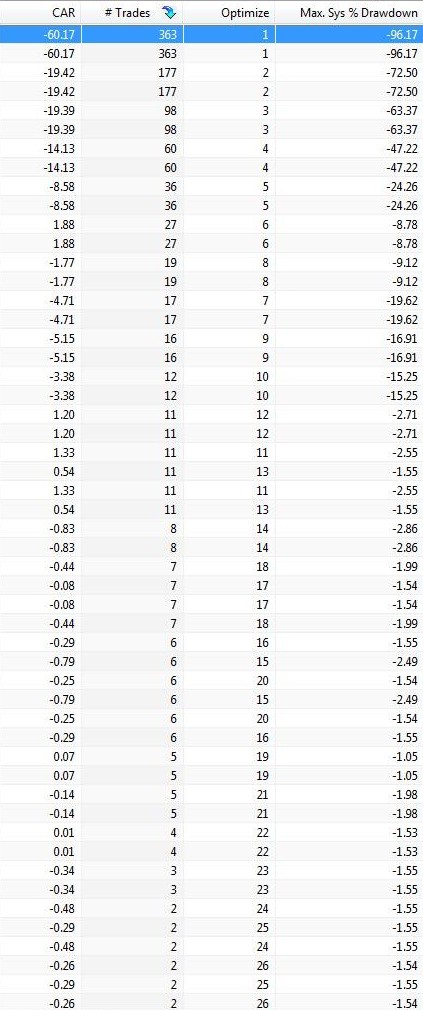
I’ve also included this optimization chart to show that if the above reason wasn’t enough to warrant not trading during low-vol periods, then the fact that the more trades you take, the more your performance deteriorates, should provide ample evidence against trading during these periods.
This is my second definition of high-volatility and low-volatility:
- HV: X-Day Standard Deviation of Daily Returns > Y-Day Simple Moving Average of X-Day Standard Deviation of Daily Returns
- LV: X-Day Standard Deviation of Daily Returns < Y-Day Simple Moving Average of X-Day Standard Deviation of Daily Returns
Once again I optimized the length of the standard deviation look-back period, and also the look-back period of the simple moving average of the X-Day standard deviation of daily returns.
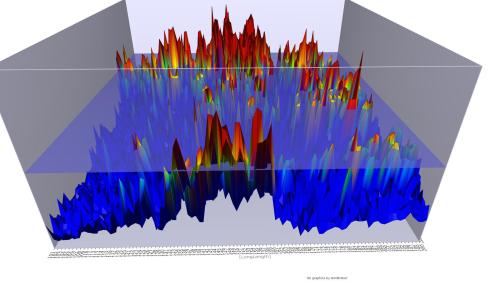
High Volatility:
Length of the standard deviation period is optimal around 10-20.
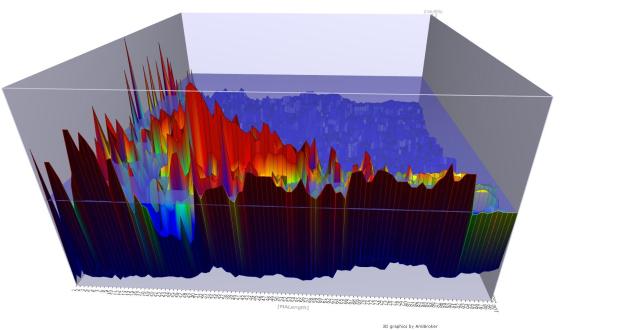
Length of MA of standard deviation look-back is optimal around 10-50.
Using an MA of length 2 has extremely positive results, yet since there are no surrounding values with similar results, then it could just be from curve-fitting the data. There are a lot of strongly performing results using an MA look back of 30-45 and a standard deviation look back of 10-20.
Low Volatility:
There is no hilly region above the break-even point; once again Mean-Reversion should not be traded during low-volatility periods.
Market Direction:
I will define bull/bear market conditions as:
- Bull: RSRank > 0
- Bear: RSRank < 0
The RSRank has two lengths within the indicator. A long look-back period and a short look-back period. I described the RSRank indicator in more detail in my previous post (actually I just linked to a post that described it).
Bull:
There is no hilly region that is above the break-even point. This reinforces the conclusion from my previous post that it is disadvantageous to trade during a bull-market.
Bear:
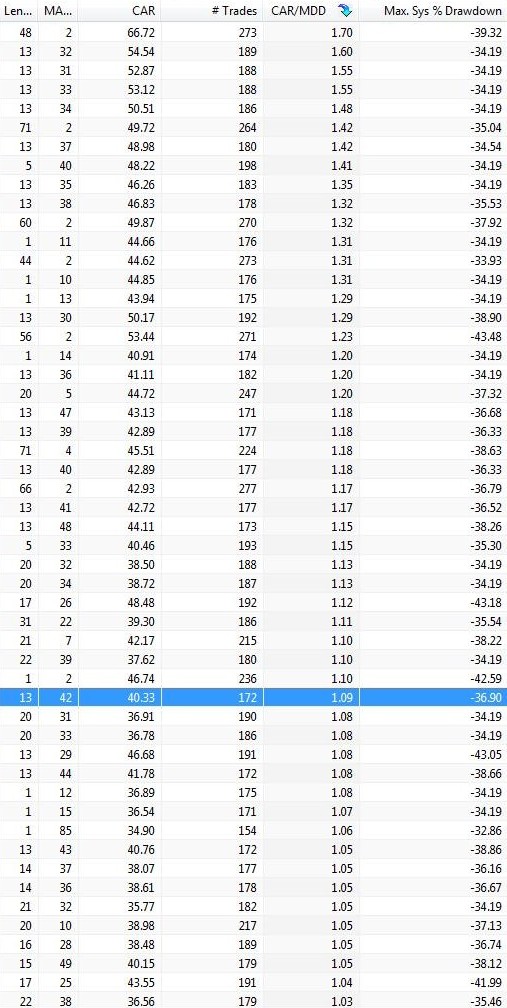
Optimal value of the long look back period for RSRank is around 140-160.
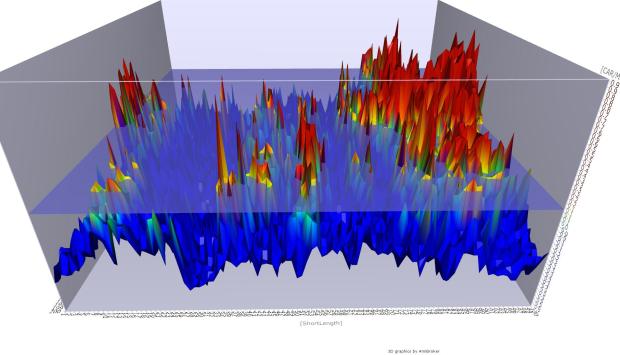
Optimal short look back period for RSRank is around 70-100.
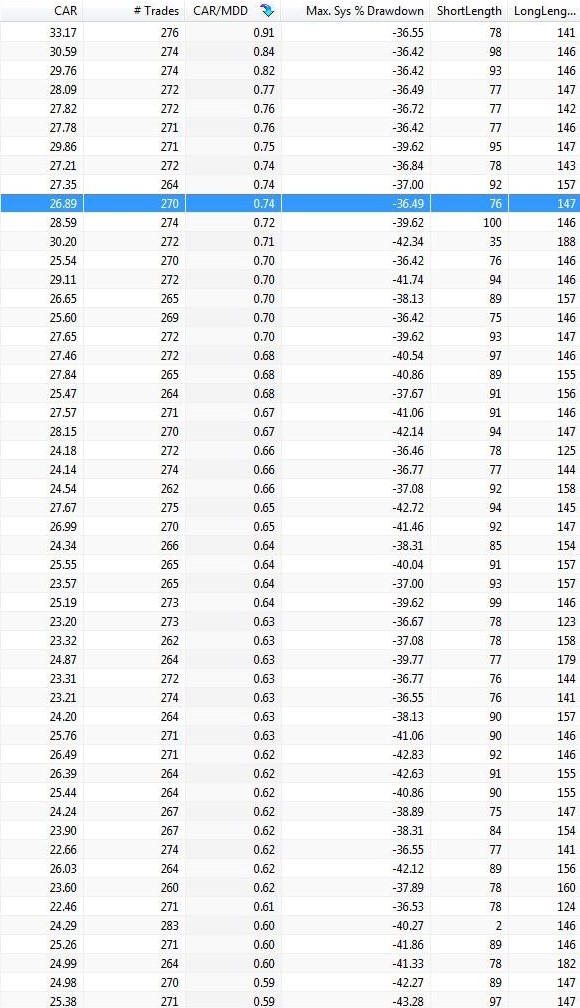
There are enough trades to prove this is statistically significant.
Conclusion:
It’s best to trade mean reversion systems during bear markets and periods of high volatility. The optimal method of classifying these regimes are with a RSRank indicator that has the long length at 140-160 and the short length at 70-100 and with a 10-30 day standard deviation along with a static threshold of .03-.04 by or using a 30-45 day simple moving average of a 10-20 day standard deviation. For further tests of robustness, one can test this system over similar but different markets (ex: QQQ).
