vxx

XIV Donchian 50/25 Breakout Trading System

While surfing through the internet I found simulated VXX and XIV data going back to 2004. Here is the VXX data and here is the XIV data.

I’ve decided to trade a 50/25 Long-Only Donchian Breakout system on XIV, despite the fact that an Oscillator based system on VXX resulted in better risk/adjusted performance (long/short systems), simply because the brokerage I use does not have shares of VXX to short. The rules of the system are simple:

Buy: The close of today is higher than yesterday’s 50-day high of the close.

Sell: The close of today is lower than yesterday’s 25-day high of the close.

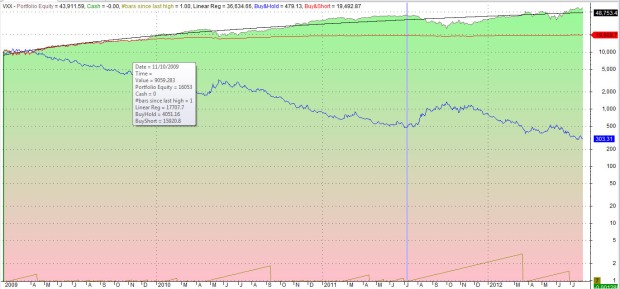
I use a 20% stop loss. This system was visually optimized, meaning I looked at the chart below while adjusting the parameters and chose parameters with round numbers that seemed to have the best risk/adjusted returns.

Visual Optimization

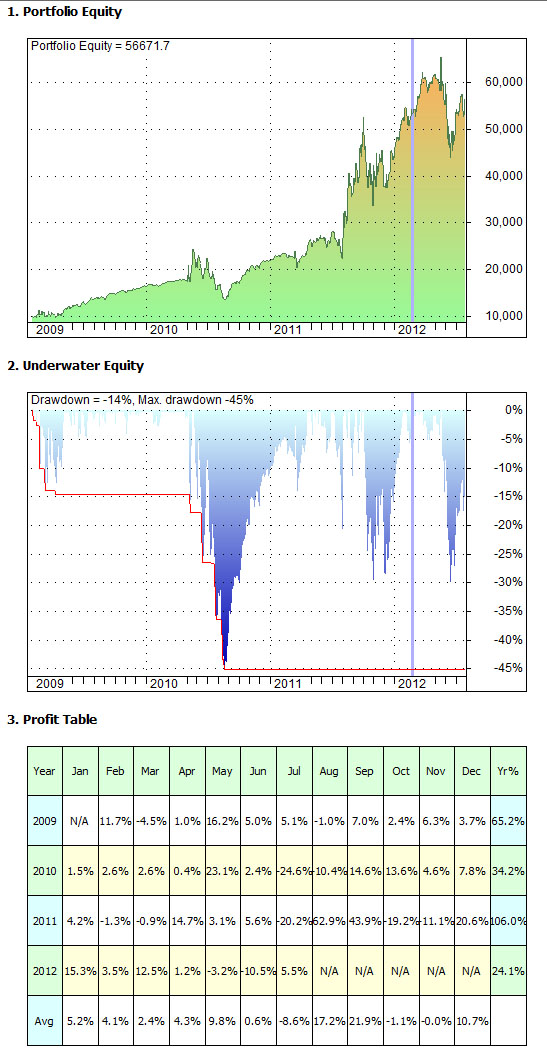
Here are the results of the system based off of the simulated data from above going back to 3/26/2004 and ending in 11/26/2012:

Result

I’ve allocated approximately 25% of my capital to this system. Friday afternoon (11/23/2012) a buy signal was generated. I bought 150 shares on the following Monday using a limit order, and managed to get filled at 18.65. I plan to follow this system until it experiences an 80% draw-down. In the future I will create a long only VXX system to use while this system is in cash.

There are two arguments against this system (or similar systems) that I’ve found:

1) 1987 style crashes will eat all the profits, and then some, that this system has generated. Found at Six Figure Investing’s post: “A Brief History of Fear.”

2) There is too little data to tell. The data dating back to 2004 only shows one current regime. According to user Damian Bergamaschi, a commenter on the post “Alpha Strategy” at Don’t Fear the Bear, “My findings show that the years 00-jan03 the market spent more days backwardated than in contango and 96-98 was almost the case as well.”

My refutations:

1) I can’t think of any reason not to be worried about this. I can only hope that my system will somehow exit before a crash of this magnitude. While the possibility of a crash of this magnitude happening within a day is slim, history has proven that it is still a possibility. If someone has an idea to safeguard against this, please share 🙂

2) I don’t think that a market with more contango than backwardation is only a regime. I think the markets have fully incorporated the fact that if there were as many days in backwardation as there is in contango, than investors could generate alpha relatively easily by using VIX-ETPs as a hedge. I could be wrong, but even if I am, the exit on a 25-day low should prevent the system from losing too much money in a backwardation environment.

VXX Directional Trading Strategy Part 2: Signals based on Oscillators

Previously, at VXX Directional Trading Strategy Part 1, I  posted research on a VXX Directional Trading System based on constant values. This post will be about a trading system on VXX using 3 oscillators William’s %R, RSI, and Stochastic.

My commissions are set at 7$ per trade with a capital base of 10,000$. All signals are based on the opening price of the day after the signal was generated. The software used is AmiBroker. The objective function used in optimization and walk-forward analysis is RAR/MDD. The data is from 1/30/2009 – 7/30/2012. The RAR/MDD of short & hold (the benchmark we are trying to beat) is 1.17.

Chart with all 3 oscillators on it This is chart of VXX, William’s % R(First), RSI (Second), and Stochastic %D (Third). All of these 3 indicators have been visually optimized (meaning that I adjusted the parameters to what seems to me the best fit). My system will generally be:

  • Short VXX if Oscillator < Constant Value
  • Long VXX if Oscillator > Same Constant Value

William’s % R:

  • Short VXX if William’s % R < Constant Value
  • Long VXX if William’s % R > Same Constant Value
// William's %R VXX System
function PercentR( periods )
{
 return -100 * ( HHV( H, periods ) - C )/( HHV( H, periods ) - LLV( L, periods ) );
}

SetTradeDelays(1,1,1,1);
BuyPrice = SellPrice = CoverPrice = ShortPrice = O;
WilliamLength = Optimize("WLength",80,1,100,1);
William = PercentR(WilliamLength);
Constant = Optimize("Constant",-70,-100,0,1);
Buy = Cover = Cross(William,Constant);
Sell = Short = Cross(Constant,William);
Optimization of William's %R System

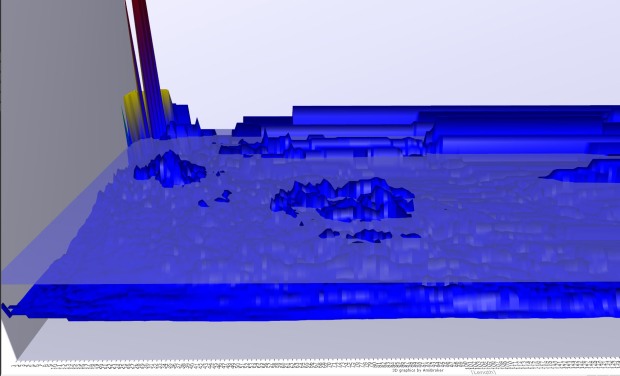
This is an optimization of William’s %R Period vs the Constant Value. There are two stable regions: when William’s %R Period is approximately 55-90 and Constant is approximately 60-75, and also when William’s %R Period is approximately 20-40 and Constant is approximately 20-40. The water line represents the RAR/MDD of Short & Hold

Here is a detailed backtest report for when William’s %R Period is 80 and the Constant 70. I chose these two values because they seem to be in the middle of the stable region.

Statistics of the 70-80 Williams System

The RAR/MDD of Short Only (4.36) is much better than the RAR/MDD of Short & Long (1.42Chart Report for the 70-80 Williams System

Comparative Chart for the 70-80 Williams System
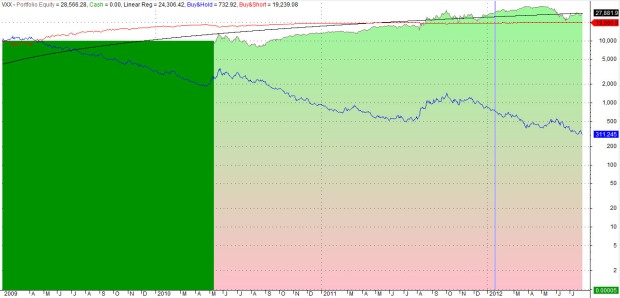
This compares the return of buy & hold, short & hold, and the 70-80 Williams System

Even though there are only 21 total trades in the 70-80 system, because of the hilly region near the beginning, it warrants further exploration of this system.

Here is a detailed backtest report for when William’s %R Period is 30 and the Constant 30. I chose these two values because they seem to be in the middle of the second (and more profitable) stable region.

Statistics Report for the 30-30 Williams System

The results of this system are much more impressive than the previous system.Chart Report for the 30-30 Williams System

Comparative Chart of the 30-30 William's %R System
This chart compares buy & hold, short & hold, and the results of the 30-30 William’s %R System.

The results of this system are much more impressive than the previous system. The CAR & the RAR/MDD are higher. Also, this system has almost double the amount of trades (41 vs 21) meaning that these results are also more statistically significant, definitely warranting further exploration.

RSI:

  • Short VXX if RSI < Constant Value
  • Long VXX if RSI > Same Constant Value
// RSI VXX
SetTradeDelays(1,1,1,1);
BuyPrice = SellPrice = CoverPrice = ShortPrice = O;
// Optimization
RSILength = Optimize("RSILength",20,1,100,1);
Constant = Optimize("Constant",55,1,100,1);
Indicator = RSI(RSILength);
// Entry/Exit Signals
Buy = Cover = Cross(Indicator,Constant);
Short = Sell = Cross(Constant,Indicator);
Optimization of RSI and Constant

This is an optimization of RSI Period vs the Constant Value. There is a stable hilly region approximately when RSI Length is 10-30 and Constant is 45-60. There are also random spikes that will be disregarded. The water line represents the RAR/MDD of Short & Hold

Here is a detailed backtest report for when RSI Length is 20 and the Constant is 55. I chose these two values because they seem to be in the middle of the stable region.

Statistics of RSI Trading System

In this system the long only system has a RAR/MDD of 2.78, short only has a RAR/MDD of 1.85, and long & short has a RAR/MDD of 1.74.                                 Long > Short > Long & Short

Report Chart for the RSI Trading System

Comparative Chart of RSI Trading System

This compares the return of buy & hold, short & hold, and the RSI System

Even though there are only 33 total trades in the RSI system, because of the hilly region near the beginning, it warrants further exploration of this system.

Stochastic

  • Short VXX if Stochastic < Constant Value
  • Long VXX if Stochastic > Constant Value

I am going to choose 3 and 3 for the D and K lengths so that there are only 2 variables left for optimization. I want D and K both to be low to produce a decent amount of trades so that the results of the backtest are statistically significant, and I chose these particular values because these values are the most commonly used.

2 Var Optimization of the Stochastic Trading System

Optimization of Stochastic Length vs Constant buy/sell value. The water line represents the RAR/MDD of Short & Hold. There seems to be 2 stable/hilly regions.

Different view of the picture above
This gives a better view of the 2 regions.

The 2 regions are approximately:

  • Constant of 30-45, Stochastic Length of 55-90
  • Constant of 55-70, Stochastic Length of 15-30

Here is a detailed backtest report for when Stochastic Length is 75 and the Constant is 38. I chose these two values because they seem to be in the middle of the stable region.

Statistics for the 38-75 Stochastic System

The short only system is much better than the long & short version.

38-75 Report chart Stochastic Trading System

38-75 Comparative Chart Stochastic Trading System

Compares buy & hold, short & hold, and the results of this system

Here is a detailed backtest report for when Stochastic Length is 18 and the Constant is 62. I chose these two values because they seem to be in the middle of the stable region.

Statistics Report for the 62-18 Stochastic system

62-18 Report Chart Stochastic Trading System62-18 Comparative Chart Stochastic Trading System

In conclusion, it seems that all 3 oscillator systems are more profitable (by means of RAR/MDD and CAR) than short & hold. The best performing system seems to be the William’s %R.

VXX Directional Trading Strategy Part 1

The idea behind this trading strategy is to be long VXX for the majority of the time in order to capture the contango effects of VIX futures. I chose VXX because this ETN has one of the longest sets of data out of all the Volatility ETPs. My goal is to stay out of the market while the VIX is moving up a significant amount, or while VIX futures are in backwardation. All the data used is daily data from Yahoo! Finance.

My commissions are set at 7$ per trade with a capital base of 10,000$. All signals are based on the opening price of the day after the signal was generated. The software used is AmiBroker. The objective function used in optimization and walk-forward analysis is RAR/MDD. The data is from 1/30/2009 – 7/30/2012. The RAR/MDD of short & hold (the benchmark we are trying to beat) is 1.17.

I have a couple thoughts on how to execute this strategy, but for this post I’m just going to test a system with signals based on whether or not the VIX is above/below a certain constant value.

Rules:

  • Buy or Exit-Short when the VIX is above a constant buy value
  • Sell or Exit-Long when the VIX is below a constant sell value

Below is the AFL code for this strategy

// Constant Directional VXX Trading Strategy
// Set trade delays and prices
SetTradeDelays(1,1,1,1);
BuyPrice = ShortPrice = CoverPrice = SellPrice = O;

VIX = Foreign("^VIX","C");
SellValue = Optimize("Sell",35,2,80,2);
BuyValue = Optimize("Buy",60,2,80,2);
Buy = Cover = VIX > BuyValue;
Sell = Short = VIX < SellValue;
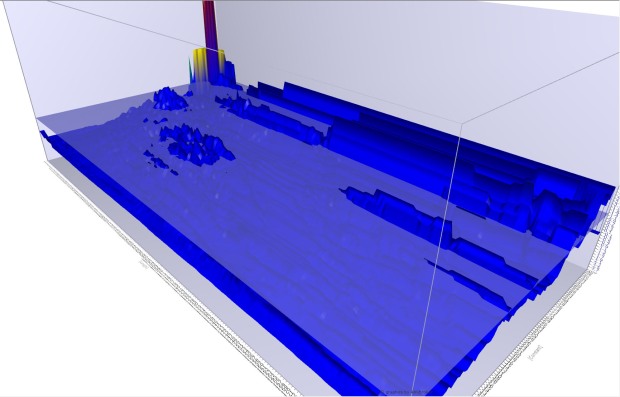
Optimization for Constant Buy/Sell values

This optimizes the values of VIX where VXX is bought/sold. The water line represents the RAR/MDD of short & hold.

From the picture above it seems that there is only 1 region that is stable and has a higher RAR/MDD than short & hold (which is 1.17, a little below the water line).

  1. Buy is 54+, and sell is 22-40.

This is a detailed backtest report for when Buy = 60 and Sell = 35. I chose these values because they seem to be well within the stable area.Statistics for the Constant Buy = 60 Sell = 35 SystemReport Chart for the Buy = 60 Sell = 35 System

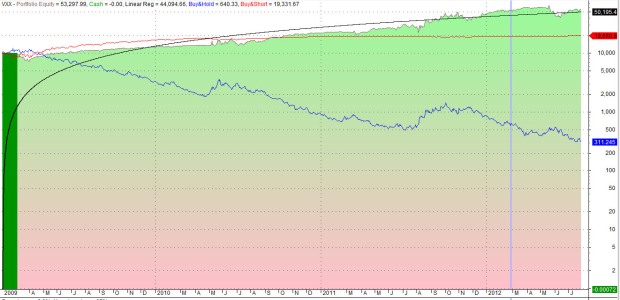
Compares short & hold, buy & hold, and equity curve of the strategy

This compares the results of the strategy (green/red) with short & hold (red) with buy & hold (blue)

We can tell from the 3 pictures above that the backtest from the selected values doesn’t differ that much from going short & holding. The only difference is a short period near the beginning of the backtest where the selected values didn’t trade, resulting in a higher objective function for the selected values. Another fact that casts further doubt on the validity of the system is that there was only one trade through the entire 2+ year period, meaning that the result is not statistically significant.

Next, I will see how this system (or a variation of this system) works with stop losses and profit targets. I will change the system a little bit so that I can optimize the inputs and keep making 3D charts.

Rules:

  • Buy or Exit-Short when VIX > a constant value
  • Sell or Exit-Long when VIX < a constant value (which will be the same as above)
  • Exit-Short/Long with a % profit target

The code will only be a little different:

// Constant Directional VXX Trading Strategy
// Set trade delays and prices
SetTradeDelays(1,1,1,1);
BuyPrice = ShortPrice = CoverPrice = SellPrice = O;

VIX = Foreign("^VIX","C");
ConstantValue = Optimize("Constant",35,2,80,1);
StopValue = Optimize("Stop",5,0,100,1);
Buy = Cover = VIX > ConstantValue;
Sell = Short = VIX < ConstantValue;
ApplyStop(1,1,StopValue,0,False,0);
Constant Stop Loss Optimization

This optimization optimizes a constant value of VIX where the VXX will be bought/sold, and the % profit target. The water line represents the RAR/MDD of short & hold.


There are only a couple regions above the water line, all of which aren’t particularly stable and seems to be the result of curve-fitting. The waterline represents a RAR/MDD that is slightly above the performance of short & hold.

My hypothesis is that the region where Buy is 64 has an objective function that is curve fit. I think that it has such a high RAR/MDD because if it is stopped out before any significant drawdowns, and is never signaled back into the trade (and thus has a lower exposure), which seems like the case, than the RAR/MDD will be relatively high even though the performance is subpar. I will test when Profit Target = 64 and Buy = 54+ to verify this hypothesis.

  1. Profit Target is 64%, and Constant Value is 60

This is the detailed backtest for when stop is 64 and constant value is 60.Statistics for the 64-60 System

Chart Report for the 60-64 SystemComparative chart for the 60-64 system

This system with profit targets of 64% and Buy of 60, only results in 4 trades, meaning that the results of this test are not statistically significant. Even though this system does have a higher RAR/MDD and CAR than short & hold and/or the original optimized system, it seems as though the results are from curve-fitting.

I am  only going to test the system with a trailing stop loss and not a maximum stop loss since it is pretty clear, visually, that VXX never goes above the initial price, and from the first test, we can see this system is very similar to short & hold so it is safe to assume that a maximum stop loss would not drastically affect the system.

The only part of the code we need to change to test a trailing stop is the very last line:

ApplyStop(2,1,StopValue,0,False,0);
Optimization of Trailing Stop Loss

This is an optimization of the % trailing stop loss vs the constant value of VIX where VXX will be bought/sold. The water line represents the RAR/MDD of short & hold.

This optimization shows that there is a stable region in the corner of the optimization chart with about Buy = 54 + and Stop  = 90+.  The region is exactly flat, meaning that it all of the systems with those variables will have similar if not exactly the same trades, and thus meaning that that entire region is

Here is a detailed backtest report for when Buy = 60 and Stop = 95:

Trailing Stop Loss Statistics ReportTrailing Stop Loss Chart Report

Once again the results of this system aren’t statistically significant due to the low amount of trades.

In conclusion, all of these systems didn’t both outperform short & hold by a significant amount and produce statistically significant results/results not a product of curve-fitting, so non of these systems are trade-worthy.

I will post research for signals based on an oscillator such as William’s %R, Stochastic, or RSI at Part 2 of VXX Directional Trading Strategy.